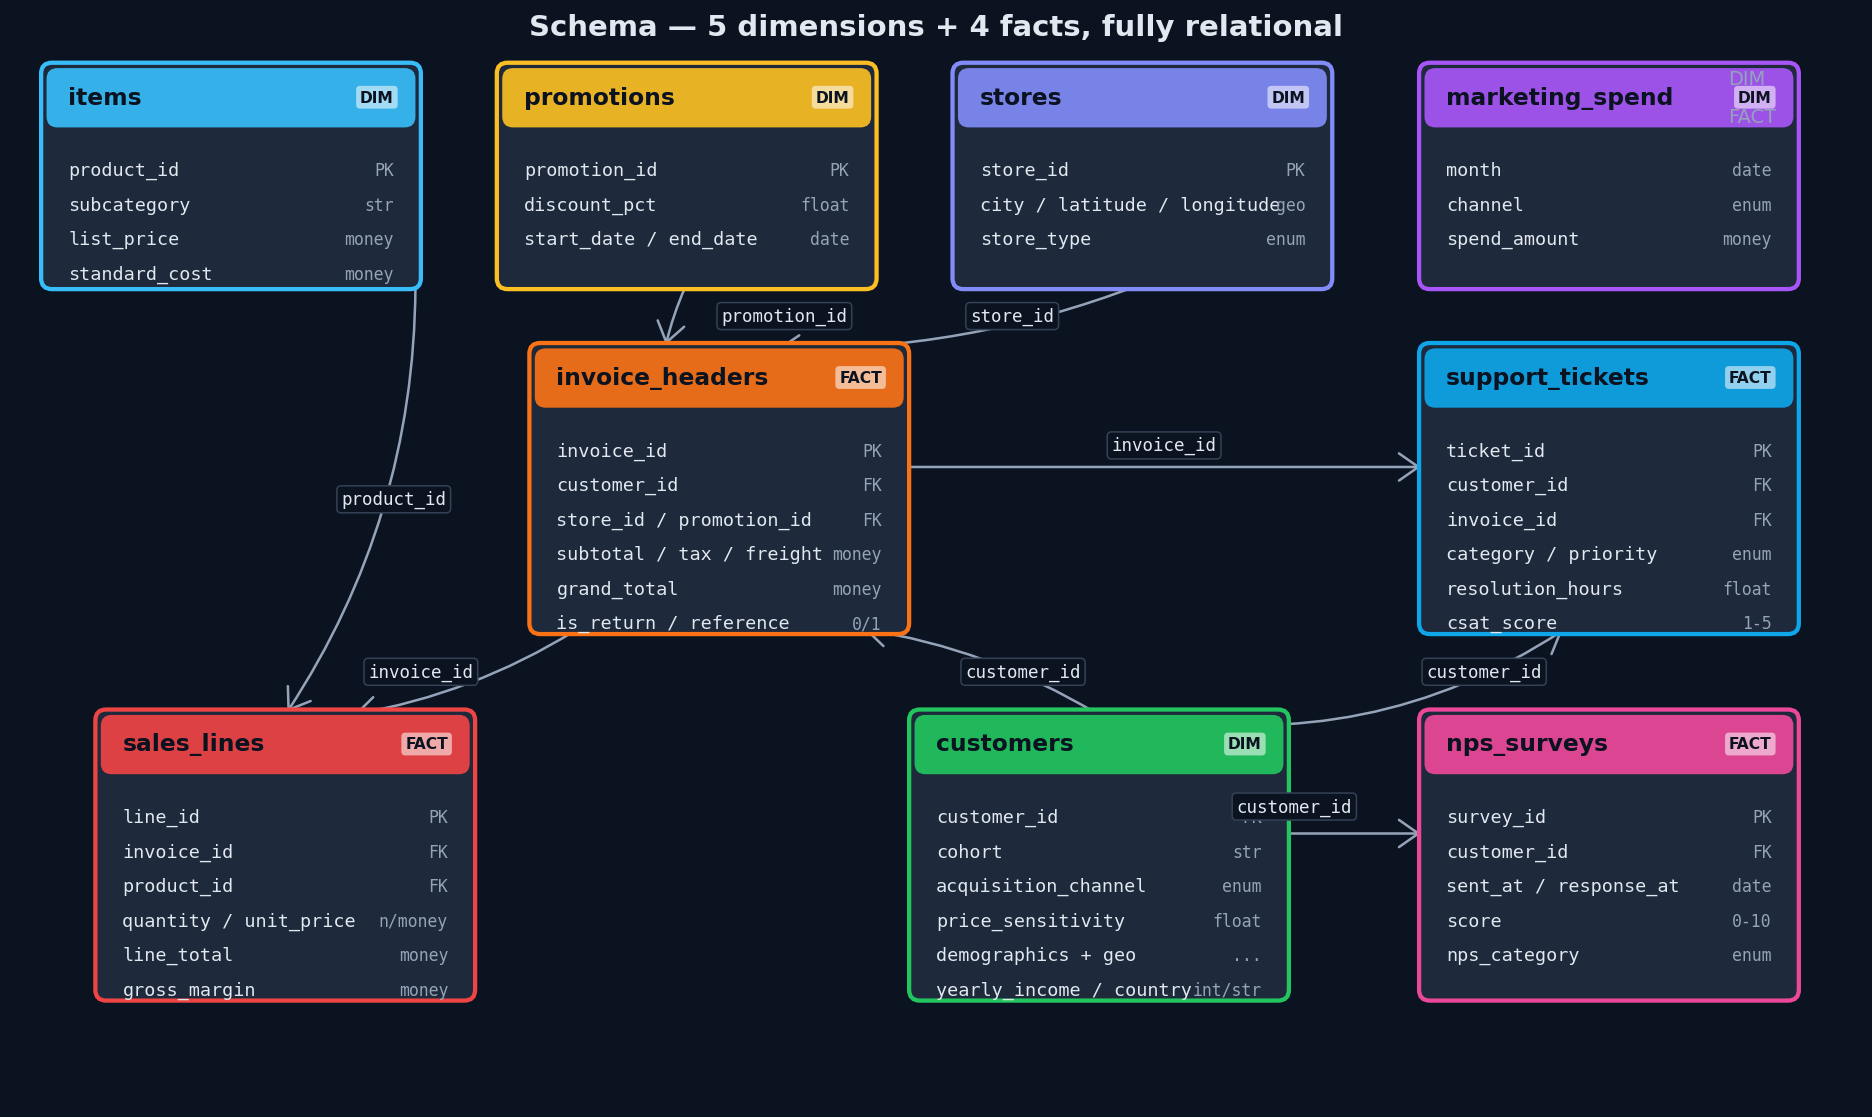
Every realism axis maps to a published model or a canonical reference. This page documents the schema, the customer behavior formula, the architecture, the full CLI, and the academic bibliography behind each design choice.
Three commands. No accounts, no API keys, no cloud setup.
git clone https://github.com/scripts-and-tables/\
erp-synthetic-data-generator
cd erp-synthetic-data-generator
pip install -e ".[charts]"
erp-synth \
--seed 42 \
--market us \
--n-customers 1000 \
--date-from 2015-01-01 \
--date-till 2025-12-31
import pandas as pd
lines = pd.read_csv(
"output_csv/sales_lines.csv")
headers = pd.read_csv(
"output_csv/invoice_headers.csv")
The full CLI surface is documented in section 6. To verify a freshly generated dataset:
python scripts/verify.py output_csv.
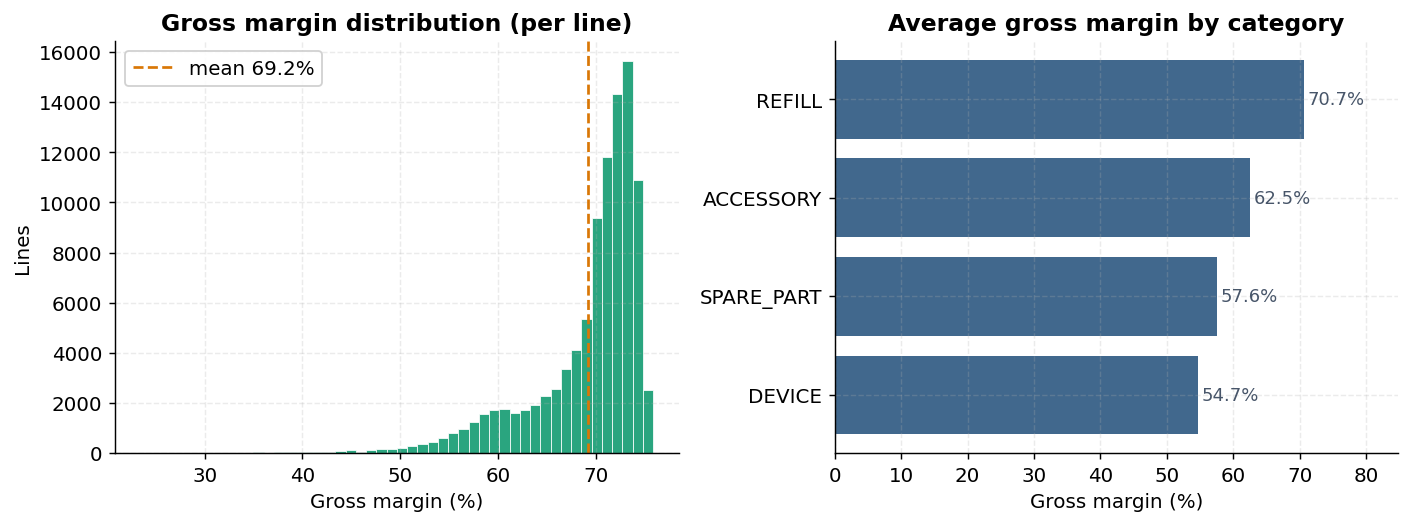
Header / line invoice split mirrors AdventureWorks' SalesOrderHeader / SalesOrderDetail, with three dates per invoice (order, ship, due), full money decomposition (subtotal → discount → tax → freight → grand_total), and explicit gross-margin tracking on every line. Plus voice-of-customer extensions: marketing spend, support tickets, NPS surveys.
| File | Type | Sample rows | Key fields |
|---|---|---|---|
items.csv | dim | 98 | product_id, list_price, standard_cost, subcategory |
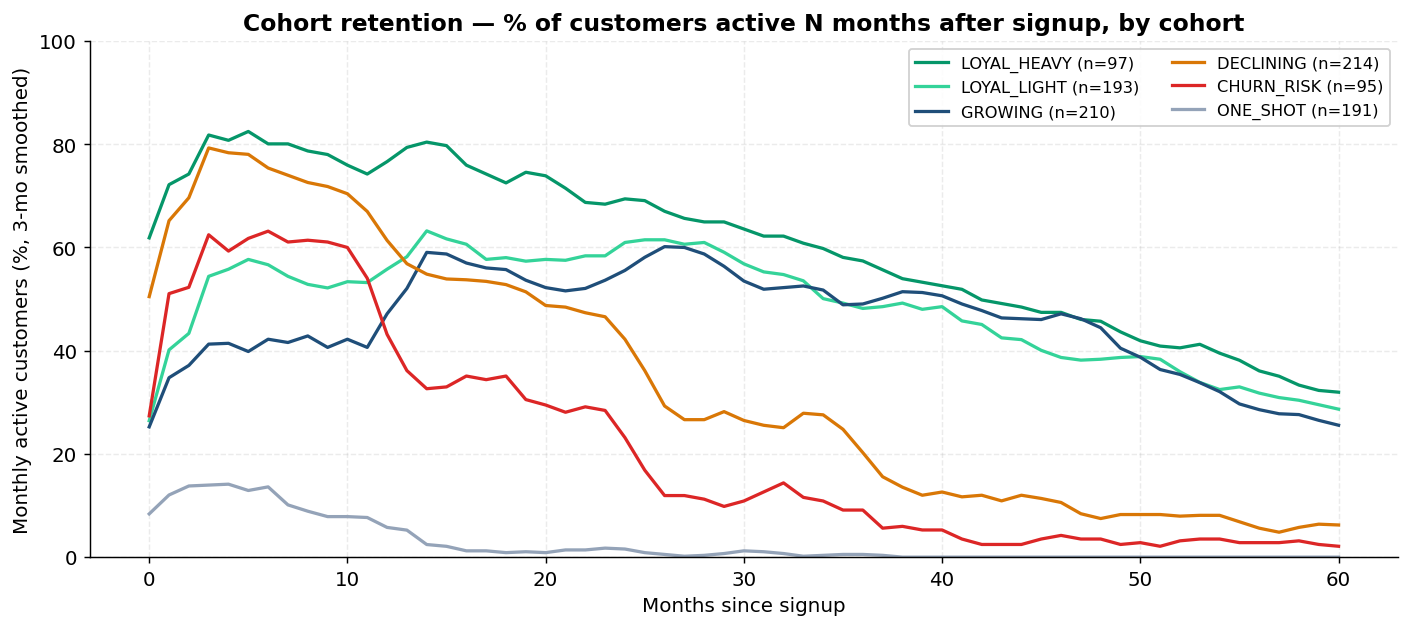
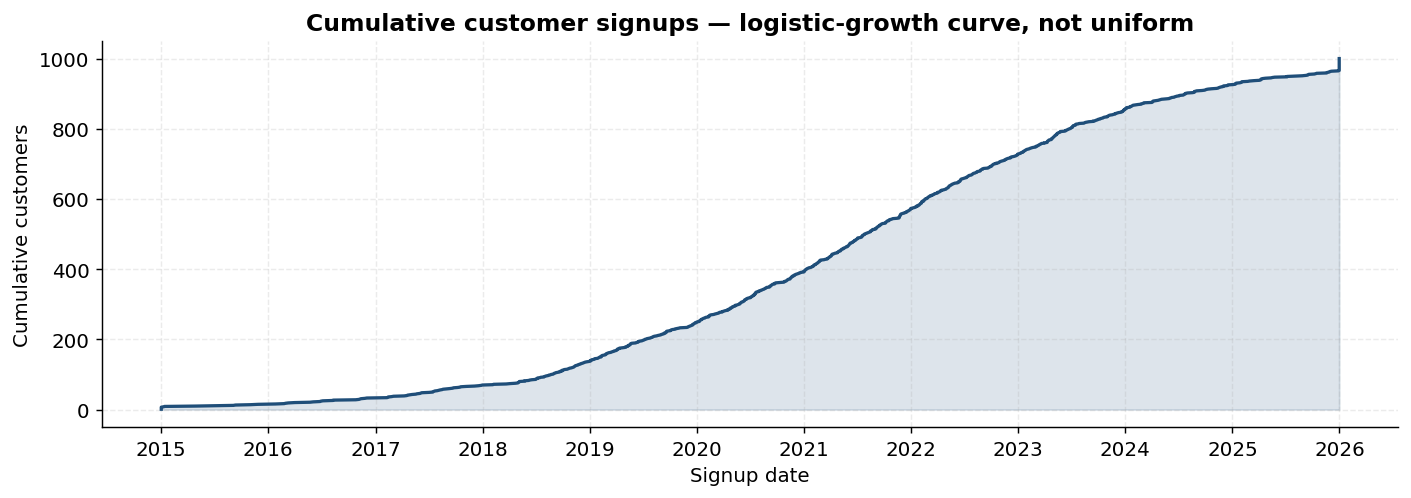
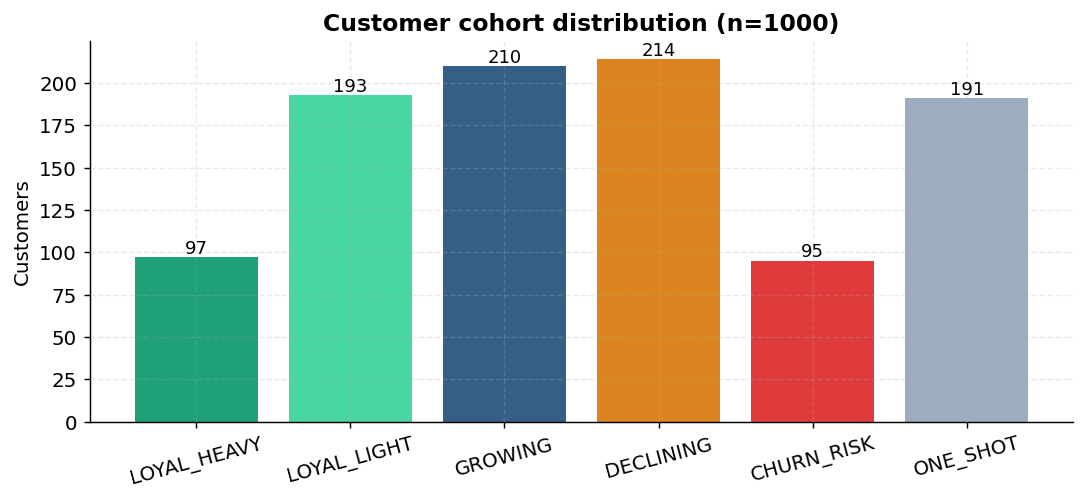
customers.csv | dim | 1,000 | customer_id, demographics, geography, cohort, price_sensitivity, acquisition_channel |
stores.csv | dim | 8 | store_id, latitude, longitude, store_type |
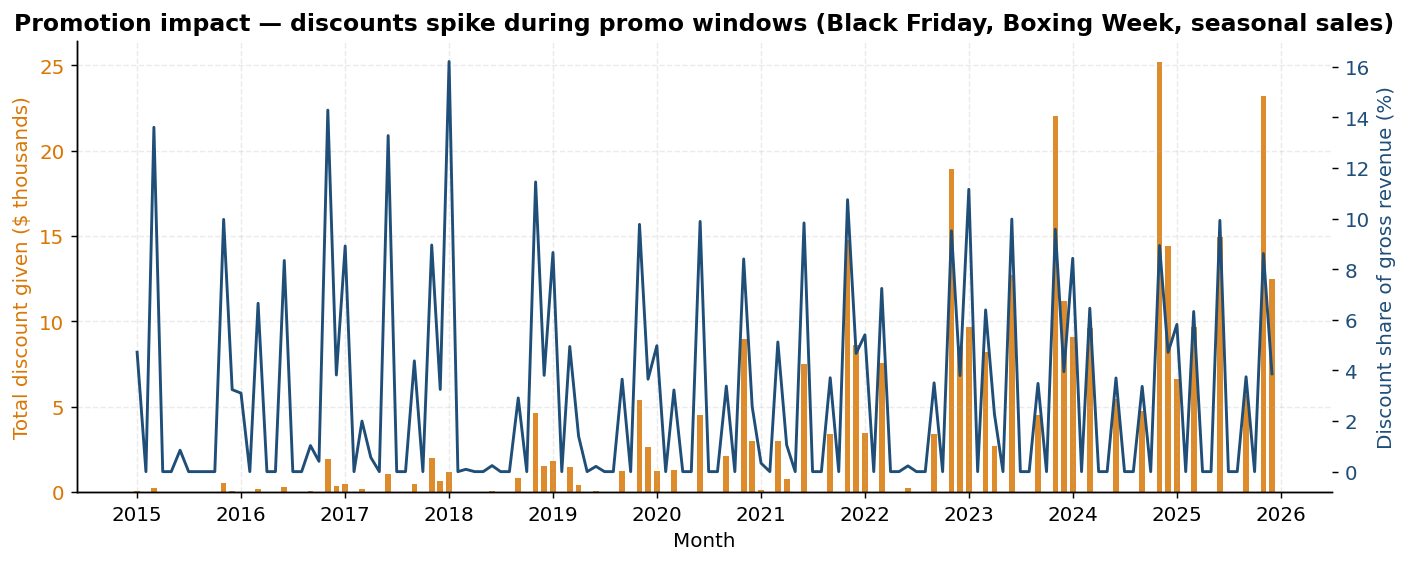
promotions.csv | dim | 66 | promotion_id, discount_pct, category_scope |
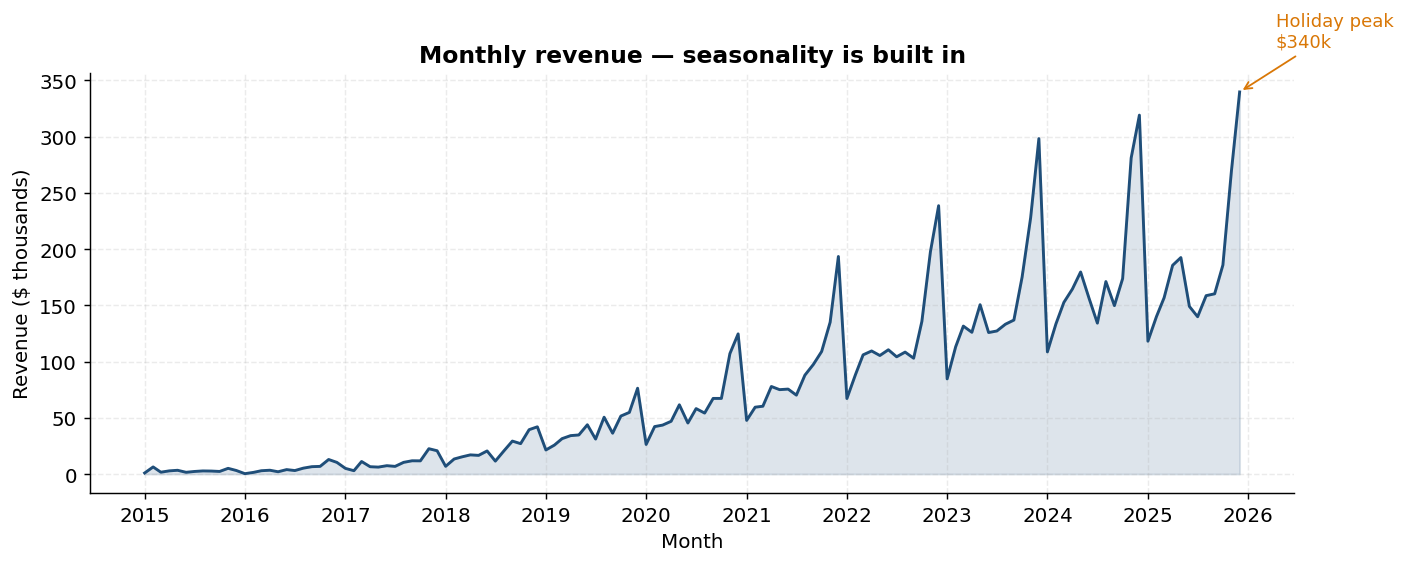
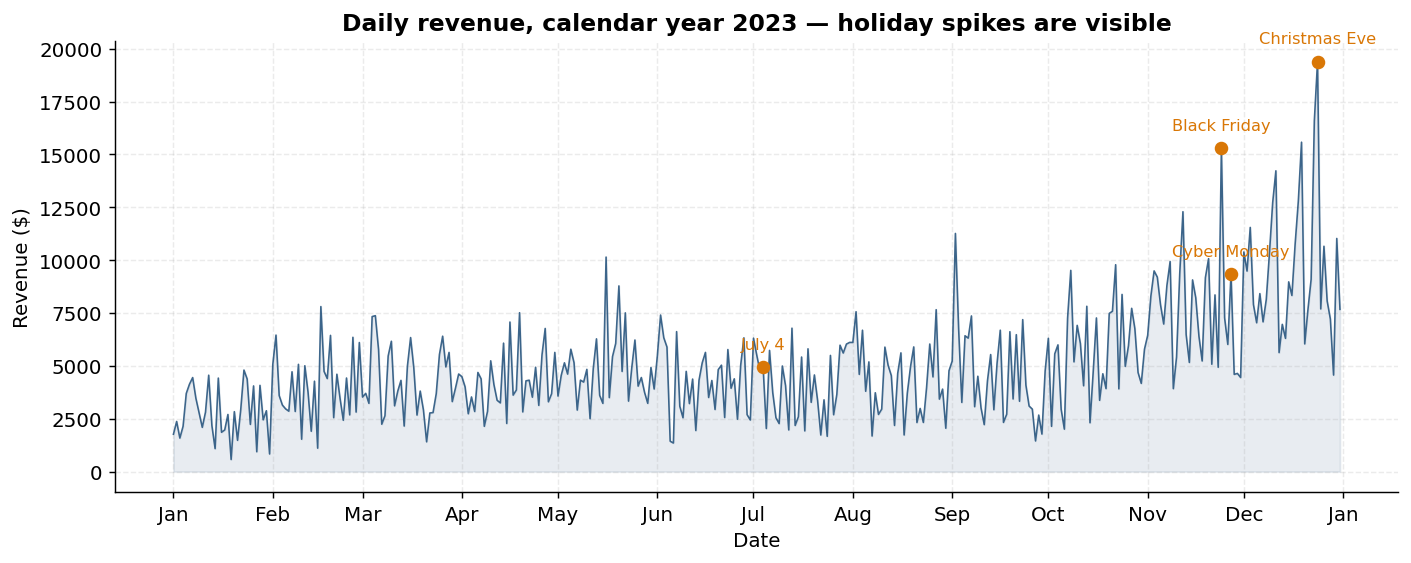
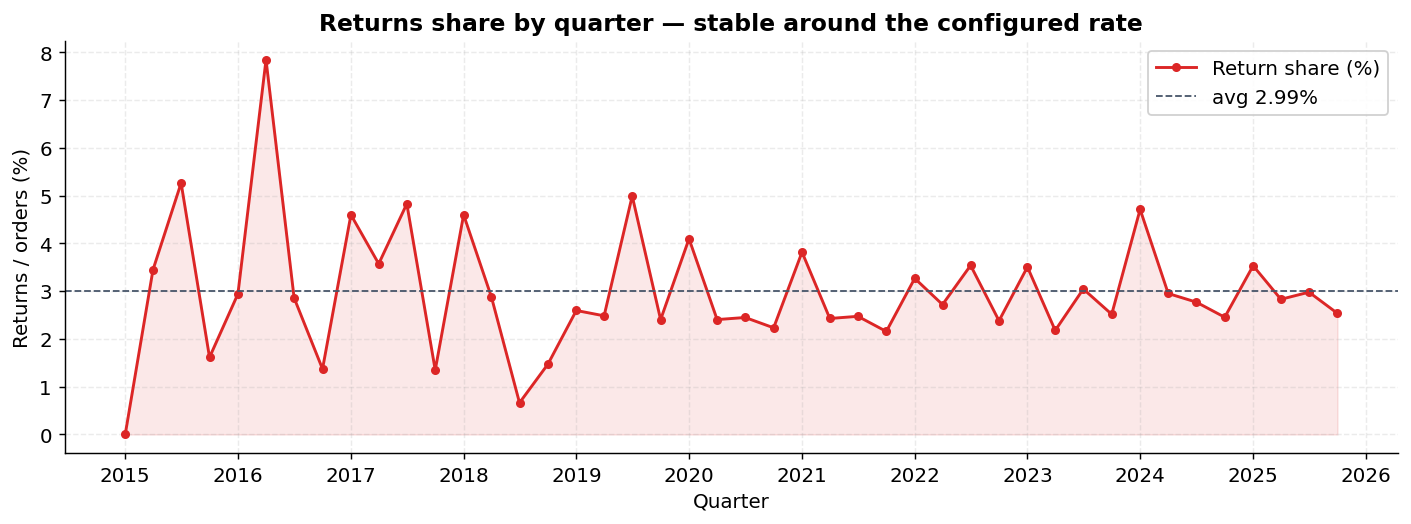
invoice_headers.csv | fact | 54,100 | 3 dates, full money decomp, payment_method, is_return |
sales_lines.csv | fact | 100,627 | quantity, unit_price, discount_pct, line_total, gross_margin |
marketing_spend.csv | fact | 792 | per-month-per-channel spend with holiday boost |
support_tickets.csv | fact | 284 | category, priority, resolution time, csat_score |
nps_surveys.csv | fact | 2,765 | quarterly survey, ~55% response, score 0–10 |
Each customer is permanently assigned to one of six cohorts via random.Random(seed ^ customer_id) — meaning the same customer always gets the same cohort across runs. Daily buy probability is then modulated by seasonality, day-of-week, holiday bumps, and the customer's price sensitivity.
| Cohort | Buy prob (Yr 1→4) | Lost / day | Refill basket | Price sens. |
|---|---|---|---|---|
| LOYAL_HEAVY (10%) | 6% → 10% | 0.0001 | up to 5 refills | 0.20 |
| LOYAL_LIGHT (20%) | 3% → 5% | 0.0001 | 1–4 refills | 0.40 |
| GROWING (20%) | 2% → 8% | 0.0002 | 1–4 refills | 0.55 |
| DECLINING (20%) | 6% → 1% | 0.0003 | smaller | 0.70 |
| CHURN_RISK (10%) | 4% → 0.5% | 0.0006 | small | 0.90 |
| ONE_SHOT (20%) | spike → 0% | 0.0008 | small | 0.85 |
p_buy_day = clip(
cohort.p_buy_by_year[year_idx] # cohort schedule
× month_factor[month] # Nov 1.6, Dec 1.8, Jan 0.7, ...
× dow_factor[dow] # weekend 1.15
× holiday_bump(date) # Black Friday 2.5, Christmas 1.8, Eid 2.0
× (1 - 0.20 × price_sensitivity),
0, 1
)
So a LOYAL_HEAVY customer on Black Friday in their fourth year buys with p ≈ 31%, while the same customer on a Tuesday in February buys with p ≈ 8%. The customer also has a sticky brand_affinity that filters their product pool toward one device family.
The cohort + lost-decision-date structure is a discrete-time analogue of the buy-till-you-die customer-base models of Fader, Hardie & Lee (BG/NBD) [4] and their generalizations to non-contractual settings [5, 10] — every customer has a constant per-period probability of "dying" (becoming permanently lost) and an independent per-period probability of buying while alive. We replace their continuous-time gamma/beta mixtures with a discrete library of six cohort presets so the dataset is parameterizable by hand and inspectable line-by-line.
The per-customer × per-product price sensitivity and brand affinity modulation comes from the multi-stage discrete-choice formulation in RetailSynth [2], itself rooted in McFadden's conditional logit / mixed logit framework [6, 7] — the framework that earned the 2000 Nobel Prize in Economics for "the development of theory and methods of analyzing discrete choice" [8].
The fidelity / utility / cohort-stickiness checks in scripts/verify.py follow the comprehensive evaluation framework for synthetic retail data proposed by Xia et al. [3].
Each architectural decision in erp-synth traces to a specific paper or canonical reference. The mapping is summarized below; full bibliography in section 7.
| Design choice | Anchored in |
|---|---|
Star-schema split into invoice_headers + sales_lines; three dates per invoice; rich DimCustomer demographics |
AdventureWorks [1] |
Customer-level latent variables (price_sensitivity, brand_affinity); discount-aware multi-stage purchase model |
RetailSynth (Xia et al. 2023) [2] |
Choice of fidelity / utility / cohort-stickiness checks in verify.py |
Comprehensive Evaluation of Synthetic Retail Data (Xia et al. 2024) [3] |
| Six "buy-till-you-die" cohorts with sticky lost-decision date and decaying yearly buy probability | BG/NBD and Pareto/NBD models (Fader et al. 2005, 2009) [4, 5] |
| Per-customer × per-product price sensitivity → product choice; market-aware payment-method weighting | McFadden conditional / mixed logit (1974, 2000), Nobel lecture (2001) [6, 7, 8] |
Reproducibility-first generator — single --seed propagates to every RNG |
Faker [9] + numpy + Python random |
All charts produced by scripts/generate_charts.py from the shipped 1,000-customer × 11-year sample (seed 42). Run with any seed to regenerate.

Recurring November / December spikes; customer-base ramp visible end-to-end.

Black Friday, Cyber Monday, Christmas Eve, July 4 — annotated.

Six behavioral cohorts diverge cleanly on retention curves.

Refills highest-margin (consumables), devices lowest. Mean drifts up over time as inflation outpaces frozen standard_cost.

Discount-as-% of revenue spikes 15–20% during Black Friday weeks vs. ~0% baseline.

Holds steady around the configured 3% rate. Earlier quarters noisier due to small N.

Slow start → ramp → plateau, replacing the uniform-random distribution most generators ship.

Six cohorts at the configured weights. Sticky per (seed, customer_id).

Premium devices and bulk industrial refills dominate revenue.
The package is organized around small, single-responsibility modules under erp_synth/. All RNG state flows through a single seed.
erp_synth/
├── rng_utils.py seeded RNGs (numpy + python random + Faker), threaded everywhere
├── markets.py US / GCC / EU presets: locale, currency, VAT, holidays, dow factors
├── seasonality.py combined_multiplier(date, market) → float
├── cohorts.py 6 sticky cohorts, deterministic per (seed, customer_id)
├── pricing.py inflation-adjusted unit price + line-level promo discount
├── stores.py store master generator (with lat/lon)
├── promotions.py promotion master + precomputed (date, category) lookup
├── returns.py negated-quantity return invoices linked via reference_invoice_id
├── marketing.py per-month-per-channel spend with holiday boost
├── support.py support tickets + NPS surveys gated by cohort propensity
├── items.py product universe + sampler
├── customers.py demographics, geography, cohort assignment, signup growth curve
└── sales.py day-by-day per-customer (headers, lines) generation
scripts/
├── verify.py schema + invariants + FK + reconciliation checks
├── generate_charts.py reproducible chart pipeline (matplotlib)
├── generate_branding.py hero, stats, schema, features, phone dashboards
└── generate_animations.py the data_unfolds.gif animation
run.py CLI orchestrator → erp-synth console script
tests/ 111 tests across 12 files
.github/workflows/ci.yml lint + tests + smoke + reproducibility check
Performance notes: Promotions are precomputed into a dict[(date_iso, category)] → (promo_id, pct) at startup so the per-line lookup inside the hot loop is O(1) instead of an O(N) pandas filter. Sales output is streamed (append per customer), keeping memory flat regardless of --n-customers. Items' listed_from_date is parsed once and cached. Holiday tables are lazy-cached per year per market.
After pip install -e ., the erp-synth console script is on PATH. It accepts the following flags:
Scale & dates
--n-customers INT number of customers (default 1000)
--date-from YYYY-MM-DD start of customer creation timeline
--date-till YYYY-MM-DD end of generation timeline
Market & realism
--seed INT master RNG seed (default 42)
--market {us,gcc,eu} locale, currency, VAT, holidays (default us)
--vat-rate FLOAT override market VAT
--currency STR override market currency
--annual-inflation FLOAT override market inflation rate
Items
--n-devices INT (default 5)
--n-accessories INT (default 10)
--n-spare-parts INT (default 8)
--n-refills INT (default 74)
--n-bulk-refills INT (default 1)
Customer fields
--p-first-name FLOAT (default 0.95)
--p-last-name FLOAT (default 0.85)
--p-email FLOAT (default 0.70)
--p-phone FLOAT (default 0.80)
--p-email-opt-in FLOAT (default 0.60, only if email present)
--p-sms-opt-in FLOAT (default 0.90, only if phone present)
--p-call-opt-in FLOAT (default 0.75, only if phone present)
Stores & promotions
--n-stores INT (default 8)
--n-promotions-per-year INT (default 6)
Returns
--p-return FLOAT (default 0.03)
--enable-returns / --disable-returns
Output
--out-dir PATH (default output_csv)
BibTeX for every entry: docs/REFERENCES.bib.